All Charts in PowerPoint Explained!

This article serves as a quick guide to all the different kinds of charts in PowerPoint.
Usage of all Charts in PowerPoint
A chart is a tool that you can use to communicate data graphically. Including a chart in a presentation allows your audience to see the meaning behind the numbers, which makes it easy to visualize comparisons and trends.
Types of charts in PowerPoint
PowerPoint has different kinds of charts from which you can choose the one that fits your data in the best way. But to use charts effectively, you will first have to understand how and when different charts are used.
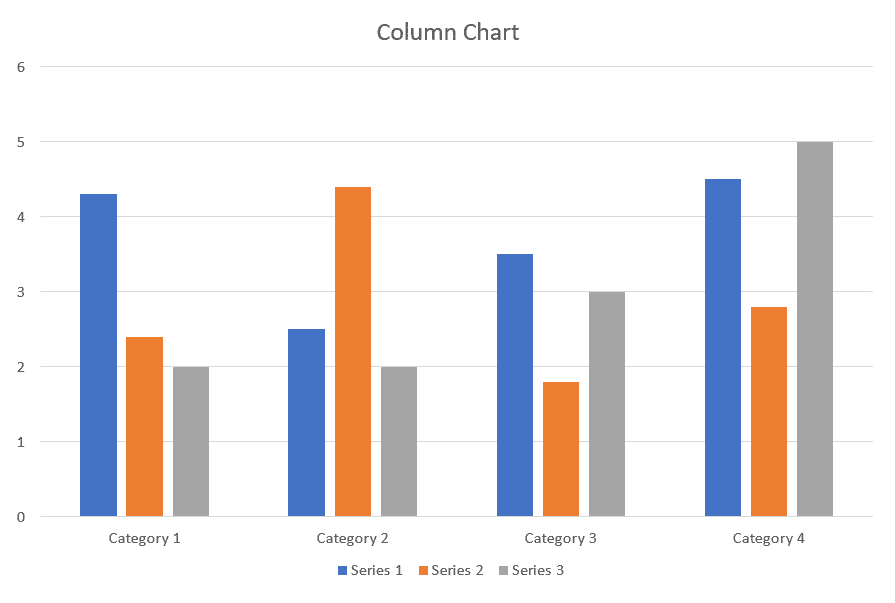
Column Charts
Column charts use vertical bars to represent data. They can work with many different types of data, but they are more frequently used for comparing information:
Types of column charts
- Clustered column and 3-D clustered column
- Stacked column and 3-D stacked column
- 3-D 100% stacked column and 100% stacked column
- 3-D column chart
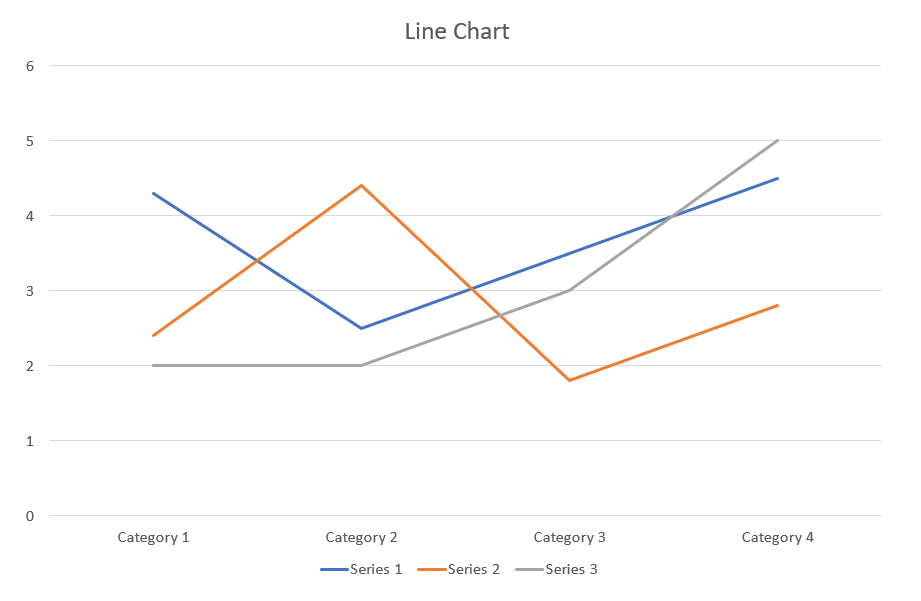
Line Chart
Data that are arranged in rows or columns on a worksheet can be easily plotted in a line chart. Line charts are ideal for showing trends, continuous data over time on an evenly scaled axis. The data points joined with lines makes it easy to see whether values are decreasing or increasing over time.
Type of line charts:
• Line and line with markers
• 3-D line
• Stacked line and stacked line with markers
• 100 stacked line and 100% stacked line with markers
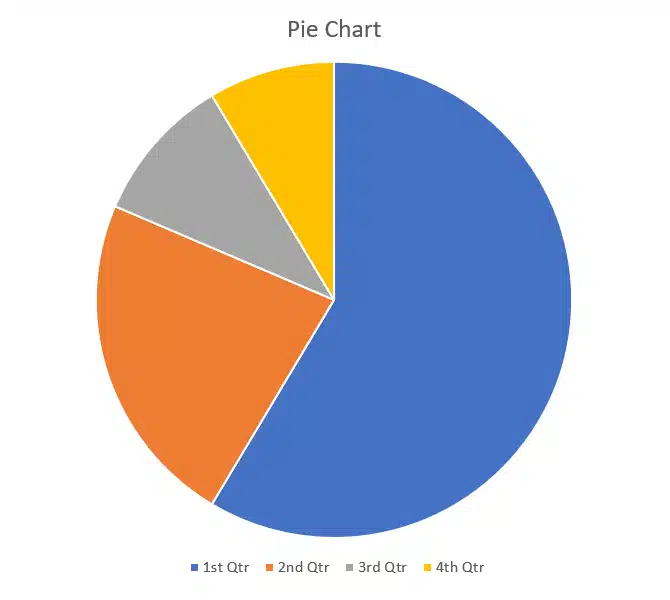
Pie Charts in PowerPoint
Data that are given in a single row or column on a worksheet can be plotted in a pie chart. Pie charts help in easy comparison of proportions. Each value is shown as a portion or slice of the pie, so it is easy to see which values make up the percentage of a whole.
The pie chart is recommended when:
• Only a single data series is given.
• When there are no negative values in your data.
• Almost none of the values in your data are zero values.
• You can have seven or fewer categories, all of which represent parts of the whole pie
Types of pie charts:
• Pie and 3-D pie
• Pie of pie and bar of pie
Doughnut Bar
Data that is given in rows or columns on a worksheet can be plotted in a doughnut chart. Similar to a pie chart, a doughnut chart shows the relationship of parts to a whole, but at times it can contain more than one data series.

NOTE: Unlike pie charts, Doughnut charts aren’t simple to read. It is better to use a Stacked bar chart or a stacked column charts instead.
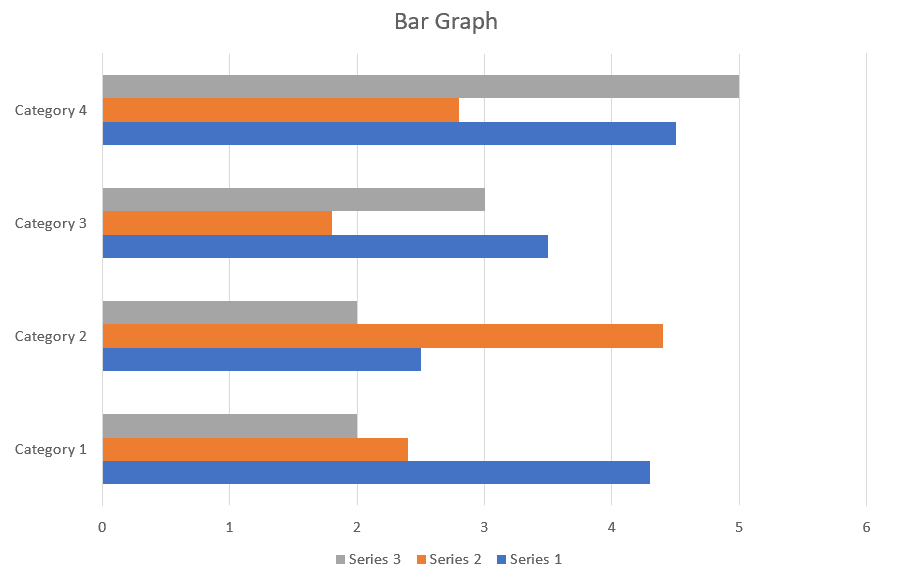
Bar
Data that is arranged in rows or columns on a worksheet can be plotted in a bar chart. Bar chart works just similar to column charts, but instead of vertical bars, they use horizontal bars. Bar charts display and explain comparisons among individual items.
Consider using a bar chart when:
• The axis labels are long.
• The values given are time taken durations
Types of Bar charts:
• Stacked bar and 3-D stacked bar
• Clustered bar and 3-D clustered bar
• 100% stacked bar and 100% 3-D stacked bar
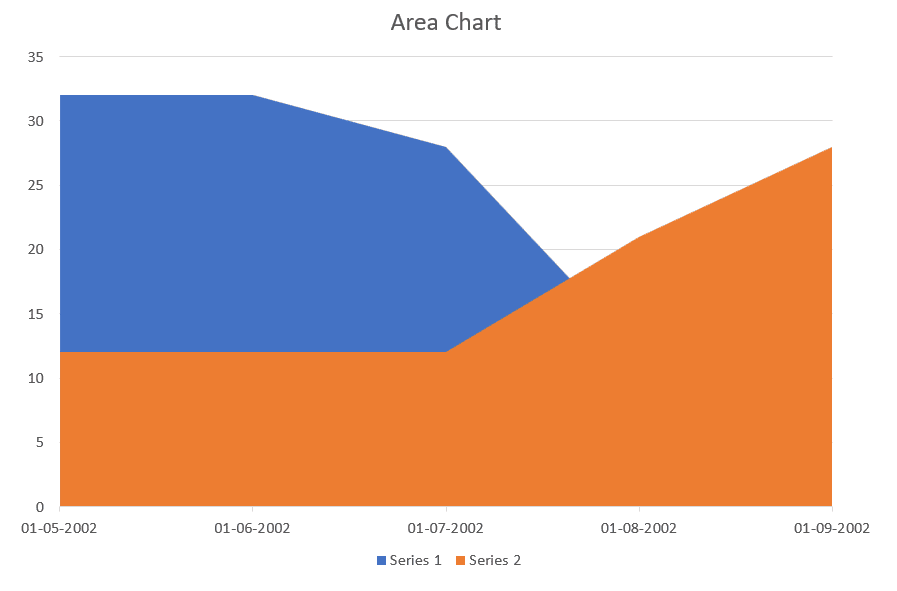
Area Charts
Area charts are somewhat similar to the line charts, except for the portions under the lines are filled in. Area charts are usually used to plot change over time and highlight the total value across a trend.
Types of area chart:
• Area and 3-D area
• Stacked area and 3-D stacked area
• 100% stacked area and 100% 3-D stacked area
Stock
This chart is used as a price chart used to demonstrate the price of a specific stock, plotted over a time frame.
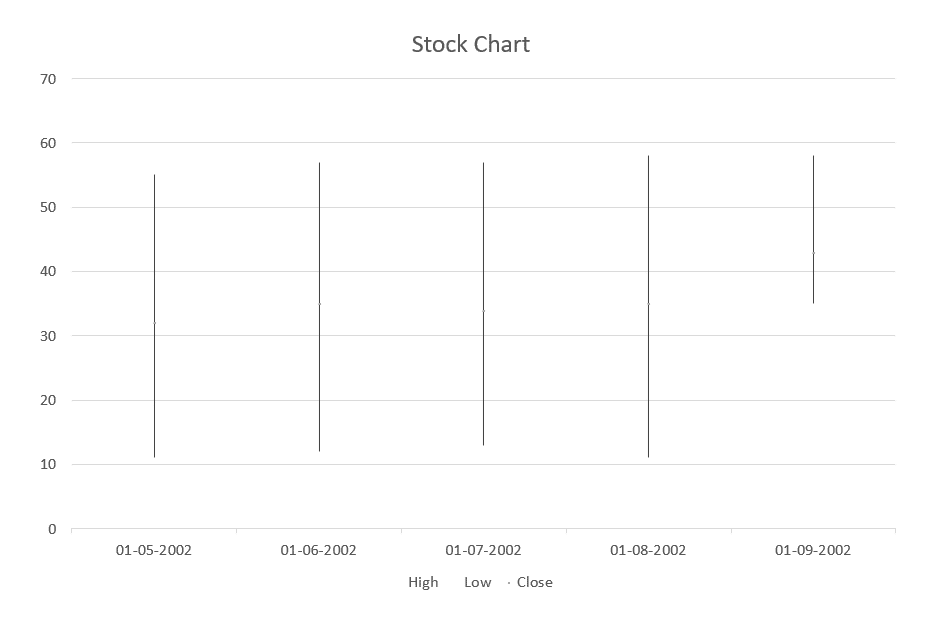
There are 4 different types of stock charts you can use in PowerPoint
- High-Low-Close
- Open-High-Low-Close
- Volume-High-Low-Close
- Volume-Open-High-Low-Close
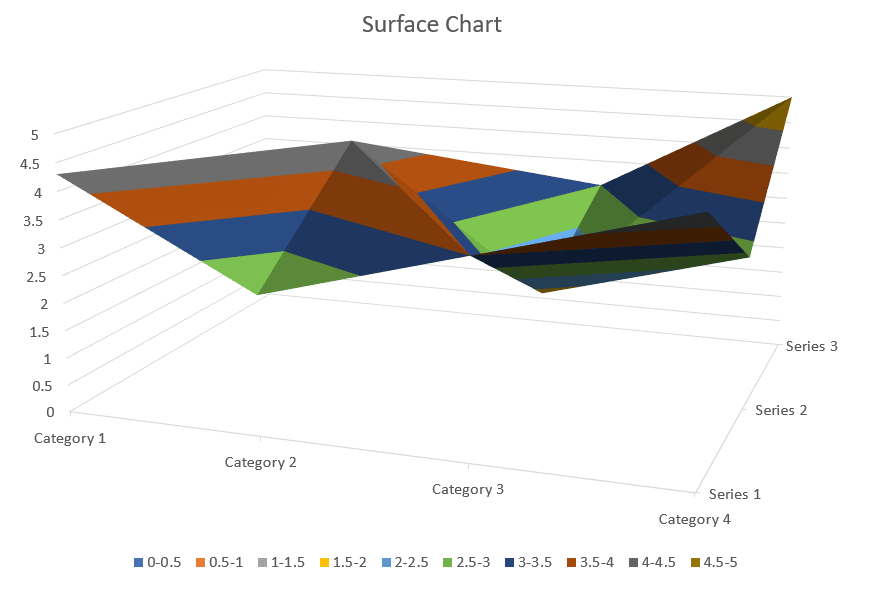
Surface Charts
Surface charts are used to display data on a three dimensional landscape. They work best with large data sets, allowing you to see a variety of information at the same time. As in a topographic map, colors and patterns indicate areas that are in the same range of values.
Types of surface charts:
• 3-D surface
• Wireframe 3-D surface
• Contour
• Wireframe contour
It’s been a long time since new chart types were added to PowerPoint. The new chart types available in PowerPoint 2016 for Windows are:
• Treemap
• Sunburst
• Histogram
• Histogram
• Box and Whisker
• Waterfall
• Combo Charts
Radar Chart
You can use a Radar chart to show multivariable data of quanititative variables mapped onto an axis. This kind of chart will seem familiar to people who have played games like PUBG.
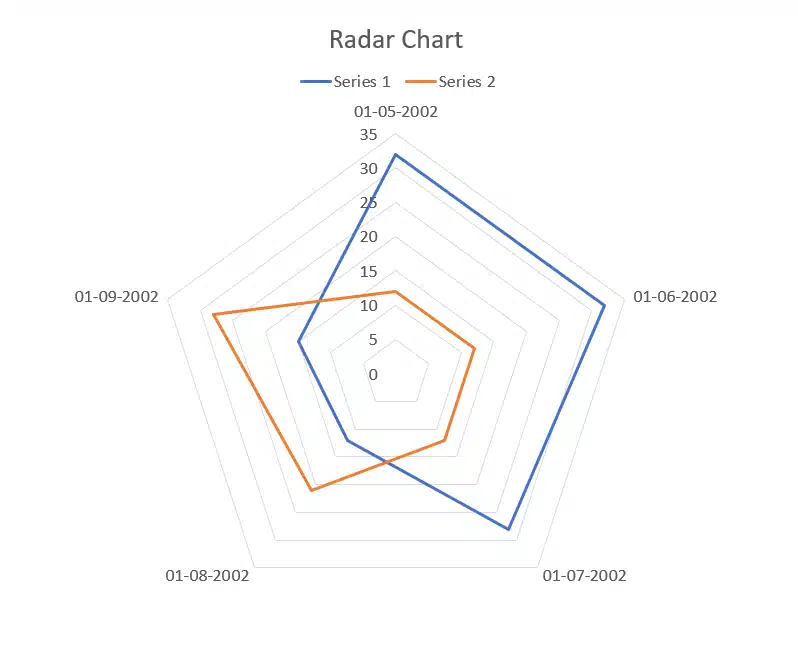
There are 2 types of Radar charts available in PowerPoint:
- Radar with markers
- Filled radar
Treemap chart
The Treemap chart gives you a hierarchical view of the data, categorized similar to the leaves and branches of a tree. By this way, you can easily compare different levels of categorization. Look at Figure below, which shows a sample Treemap chart.
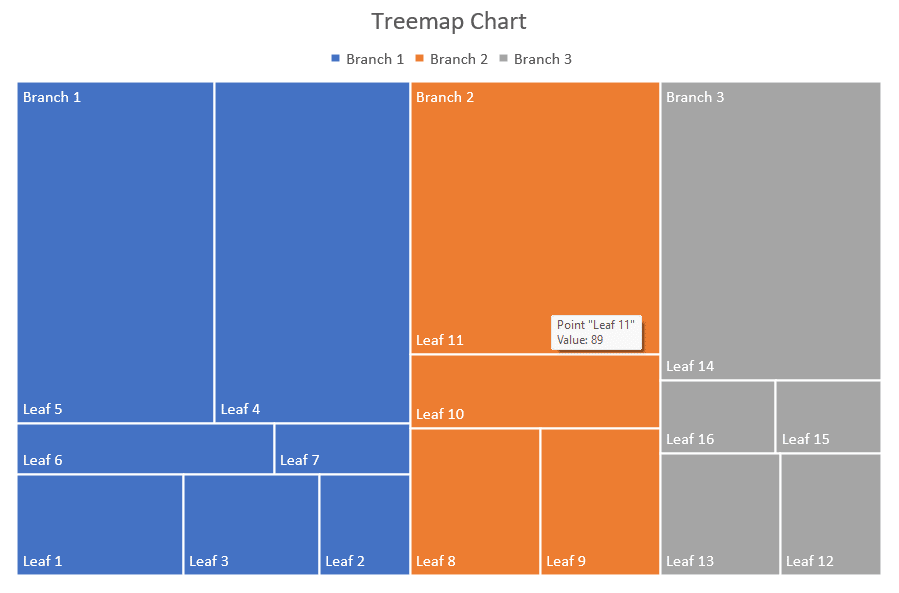
There are no chart sub-types available for Treemap charts in PowerPoint.
Sunburst chart
The new Sunburst chart displays the whole hierarchy of categories to provide analysis capabilities of more depth and can be plotted when blank cells exist within the hierarchal structure. This chart type helps to find out the most massive contributing sections within a hierarchy of multiple levels.The figure shows a sample Sunburst chart.
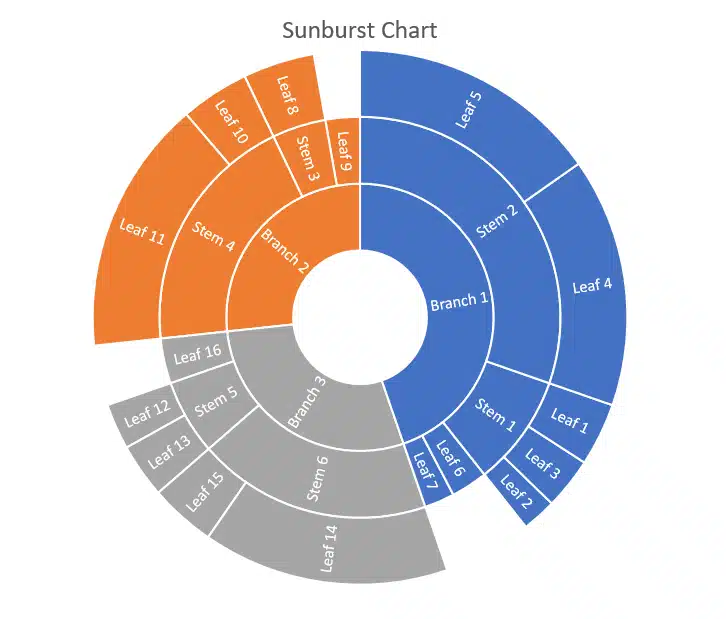
There are no chart sub-types provided for sunburst charts in PowerPoint.
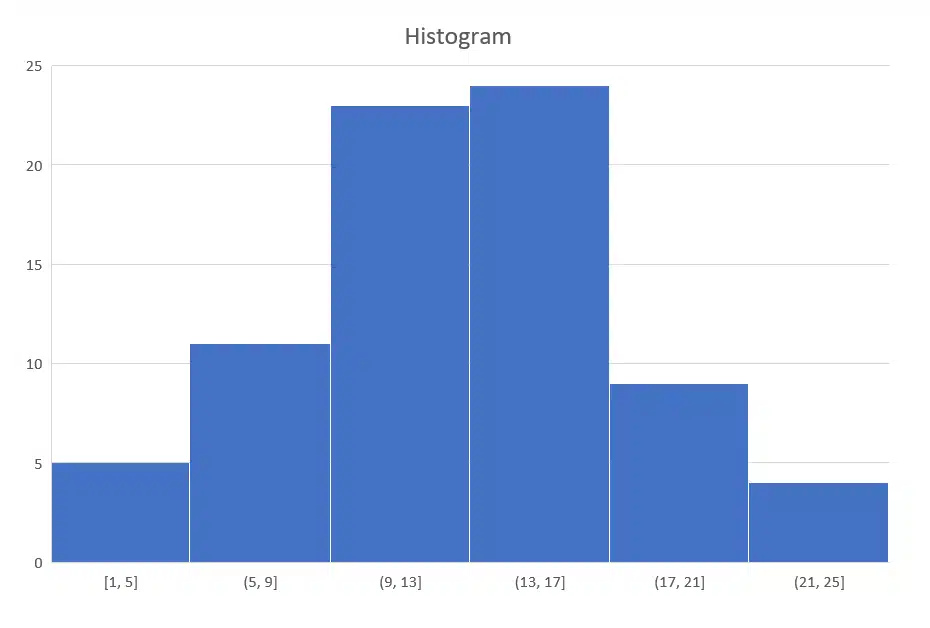
Histogram
Suitable for statistics, a histogram automatically displays the frequencies within a distribution, as shown in Figure. Every single column of the chart is called a bin and can be changed to analyze your data further.
Types of histogram chart:
• Pareto chart
A Pareto is different histogram chart that contains both the columns arranged in descending order and a line representing the total cumulative percentage.
• Histogram
The histogram chart shows your data grouped into frequency columns called bins.
Box & Whisker chart
A Box & Whisker chart demonstrates the distribution of data into ‘quartiles,’ emphasizing the mean and outlier values. The have lines on the boxes extending vertically are called “whiskers.” This chart type is used when there are multiple data sets which relate to each other in one way or the other. The figure below shows a sample Box & Whisker chart.
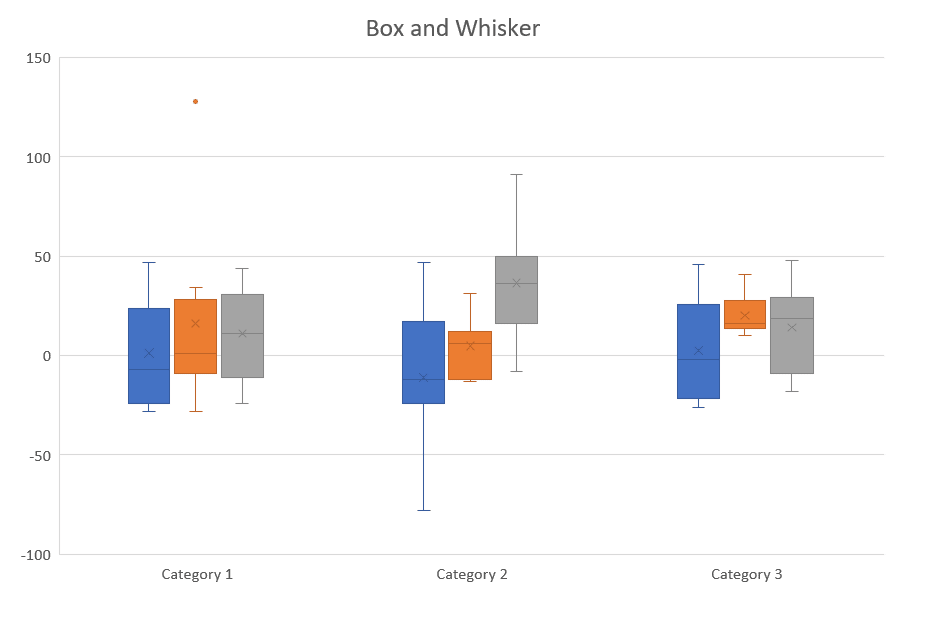
There are no chart sub-types provided for box and whisker charts in PowerPoint.
Waterfall Charts
By using the Waterfall charts, you can easily find out and understand the gains and losses caused by each item. It is helpful in understanding how an initial value is affected by a series of negative and positive values. The columns are color-coded distinctively for easy understanding of positive from negative numbers. The figure below shows a sample Waterfall chart.
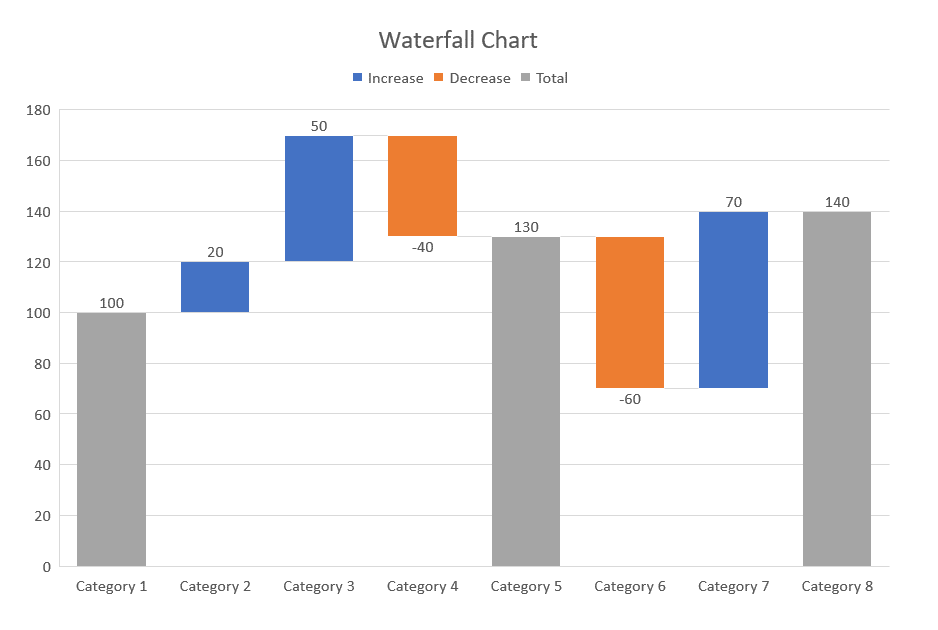
There are no chart sub-types provided for waterfall charts in PowerPoint.
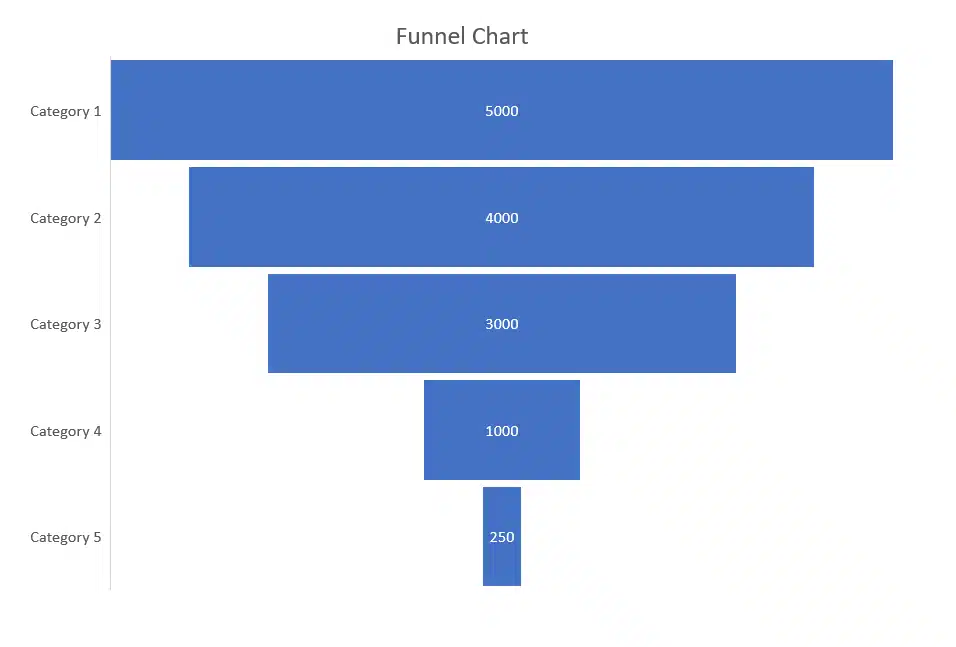
Funnel Charts
Funnel charts are used to demonstrate the flow of users or audience through a business or a sales process. These charts are seen mostly in business or sales contexts. Funnel charts are used to track how users drop out of a process or flow. This is used by marketers, and people in sales to check where users are dropping out of a sales/marketing funnel and make changes and improvements wherever needed.
Combo Charts
Combo chart combines two or more chart types for easy understanding of data, especially when the data is widely diverse.
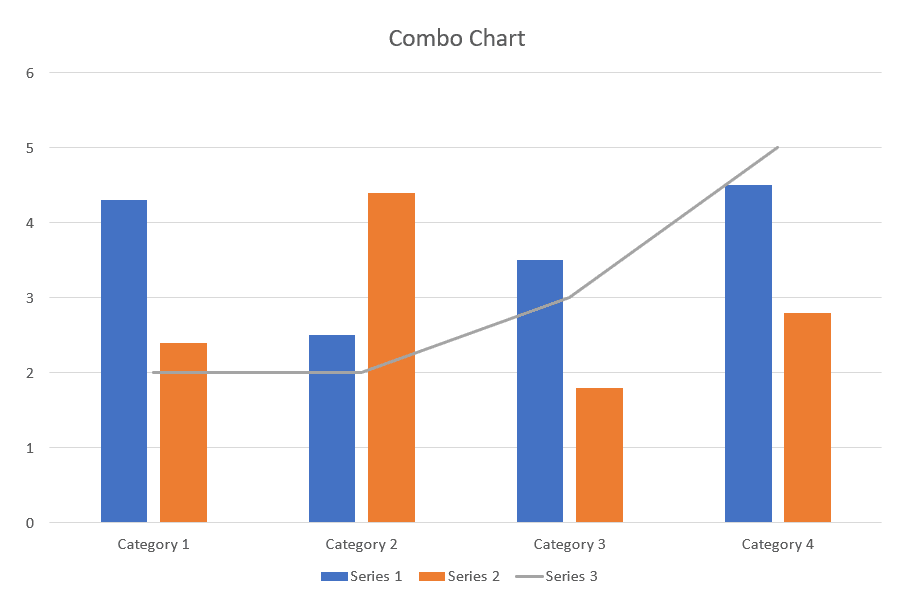
Types of combo charts:
• Clustered column-line, Clustered column- line on secondary axis
• Stacked area – clustered column
• Custom combination
So there you have it. A list of the different charts in PowerPoint along with some basic information on how they are used. We hope you found this article useful. Check out our blog for more articles like this!